



How Gcore can speed up your pages for customers around the world
- September 3, 2026
- 4 min read

A page served from a single origin can perform very differently depending on where the person loading it is located. For a website owner testing close to that origin, the difference is easy to miss. We wanted to measure how much an optimized delivery setup could change it.
We built the same media-heavy landing page using two setups and tested both five times from nine cities around the world: São Paulo, Toronto, Los Angeles, London, Amsterdam, Tokyo, Dubai, Sydney, and Cape Town. We ran the tests using WebPageTest and used the median result for each city. One version was served from a single origin in São Paulo. The other used Gcore CDN, Image Optimization, and Video Streaming.
The Gcore-optimized setup was faster in every city median. Using Document Complete as the page-finish metric, the average of the nine city medians fell from 3,049 ms to 424 ms, an 86% reduction, or 7.2x faster.
The same page, two delivery setups
The page design and content remained the same in both versions. The page used seven JPEG images, some displayed in a gallery, plus a video player. What changed was how those assets reached the browser and how some of them were handled during the initial load.
Layer | Original version | Optimized version |
|---|---|---|
Delivery | Single Hostinger origin in São Paulo | Gcore CDN delivery |
Images | Original JPEG assets | AVIF variants through Image Optimization |
Video loading | Player requests began during the initial load | Player requests began when the visitor scrolled toward the video |
The images were already lazy-loaded on the original page. In the optimized version, Image Optimization converted the JPEGs to AVIF, while video requests were deferred until the visitor scrolled toward the player.
We tested both versions using WebPageTest. Each test was run five times, and we used the median result for each city throughout the comparison.
The optimized setup was faster in all nine cities
The size of the improvement varied considerably, but the direction did not: the optimized setup recorded a faster median Document Complete time in every city we tested.
Test city | Original median | Optimized median | Improvement |
|---|---|---|---|
São Paulo | 550 ms | 386 ms | 1.4x |
Toronto | 1,901 ms | 384 ms | 5.0x |
Los Angeles | 2,740 ms | 307 ms | 8.9x |
London | 2,616 ms | 279 ms | 9.4x |
Amsterdam | 2,751 ms | 242 ms | 11.4x |
Tokyo | 3,641 ms | 498 ms | 7.3x |
Dubai | 3,947 ms | 207 ms | 19.1x |
Sydney | 4,419 ms | 318 ms | 13.9x |
Cape Town | 4,875 ms | 1,197 ms | 4.1x |
The results show why only testing a site from a location close to its origin can give an incomplete picture. The original page finished in a median of 550 ms in São Paulo. The same page took 4,419 ms in Sydney and 4,875 ms in Cape Town.
The improvement ranged from 1.4x in São Paulo, where the original server was located, to 19.1x in Dubai. Eight of the nine optimized city medians were below 500 ms.
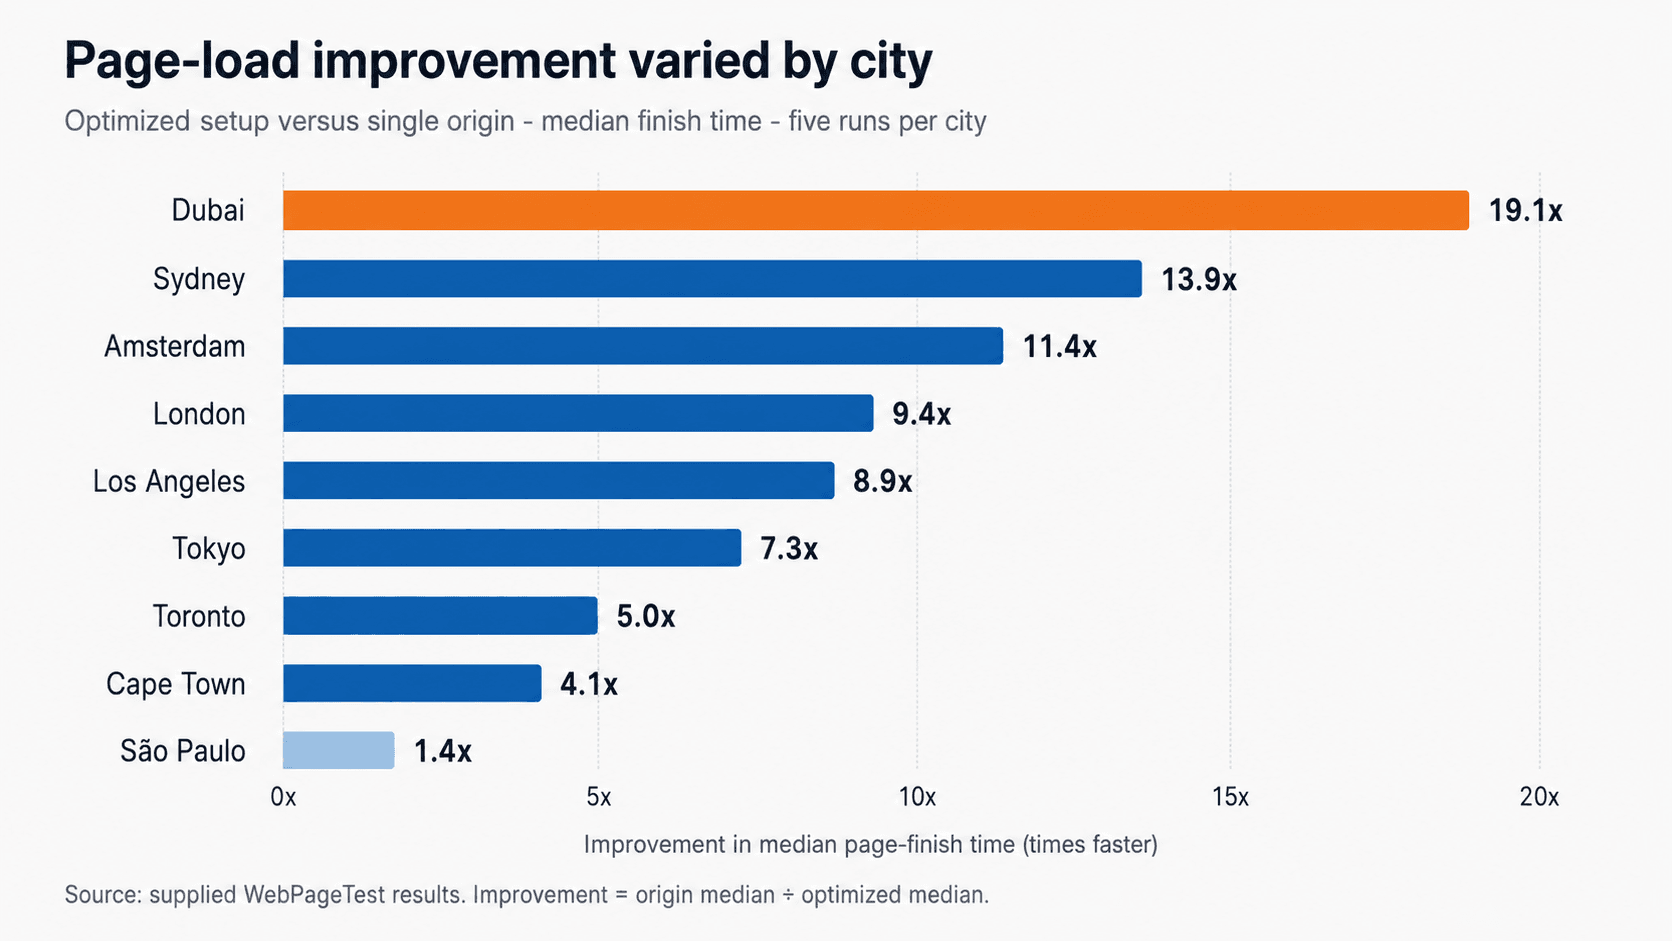
There was also variation within individual tests. Cape Town was the slowest optimized location at 1,197 ms. Its optimized requests were served from locations outside South Africa, yet the page still finished 4.1x faster than the original version. Tokyo included two unusually slow optimized runs, including one marked as a network failure by WebPageTest. We kept those results rather than removing them, and the published figures remain the medians of all five runs.
The result also depends on which part of the loading experience we measure. Document Complete, which records the browser's initial load milestone, improved 7.2x across the nine city medians. Largest Contentful Paint (LCP), which measures when the largest visible element appears, improved 4.4x.
| Metric | Origin average | Optimized average | Improvement |
|---|---|---|---|
| Document Complete | 3,049 ms | 424 ms | 7.2x |
| Largest Contentful Paint | 2,307 ms | 522 ms | 4.4x |
Original and optimized values are averages of the nine city medians.
The difference makes sense because the main content on the original page could appear while later images and video work continued. Both metrics improved substantially, but they measure different moments in the loading experience.
What changed when the page was optimized
The nine-city results tell us how much faster the optimized setup was. Looking more closely at London helps show what was happening during the page load.
Measure | Original version | Optimized version |
|---|---|---|
Time to First Byte (TTFB) | About 570 ms | About 46 ms |
Page finished loading | 2,616 ms | 279 ms |
Transferred amount | 4.7 MiB median | About 298 KiB |
On the original page, the first byte arrived after about 570 ms. The browser then fetched the page assets from the São Paulo origin. The seven JPEGs totalled 2,081 KiB, while the video player also began making requests during the initial load.
On the optimized page, the first byte arrived after about 46 ms. Image Optimization converted the seven JPEGs to AVIF, reducing their combined size to 573 KiB, 72.5% smaller, and the video player made no requests before the visitor scrolled to it.
The 4.7 MiB figure in the table is the median transferred amount across the five original London runs rather than a fixed page size. The amount varied because lazy-loaded images sometimes began loading before Document Complete. All five optimized runs transferred almost the same amount.
Give your customers their time back
The practical lesson for a website owner is to test from where your customers actually are. A page that feels fast close to its origin may behave very differently for someone thousands of kilometers away.
That waiting occurs before the customer can do whatever the page exists for: browse a product, start a checkout, watch a video, or complete a sign-up. A Google-commissioned study of 37 mobile brand sites found that a 0.1-second improvement in site speed was associated with higher conversion rates for brands in the retail and travel industries. Our experiment did not measure conversions, but it demonstrates how much the loading experience itself can vary.
It also shows why optimization isn't one thing. In our London tests, the improvement coincided with a faster first byte, smaller image assets, and deferring video requests until they were needed. CDN delivery was part of the setup, but so was reducing the amount of work the browser had to do during the initial load.
The experiment does not tell us that every website will become 7.2x faster, or isolate how much of the improvement came from each individual change. It shows what happened when those changes were applied together to the same page and tested repeatedly under the same methodology.
You can compare the two pages yourself: original version and Gcore-optimized version.
Want to try a similar setup? Explore Gcore CDN, Image Optimization, and Video Streaming.
Want to try it yourself? Get started with Gcore’s PAYG plan for CDN, Image Optimization, and DNS. Video Streaming is available separately.
Methodology
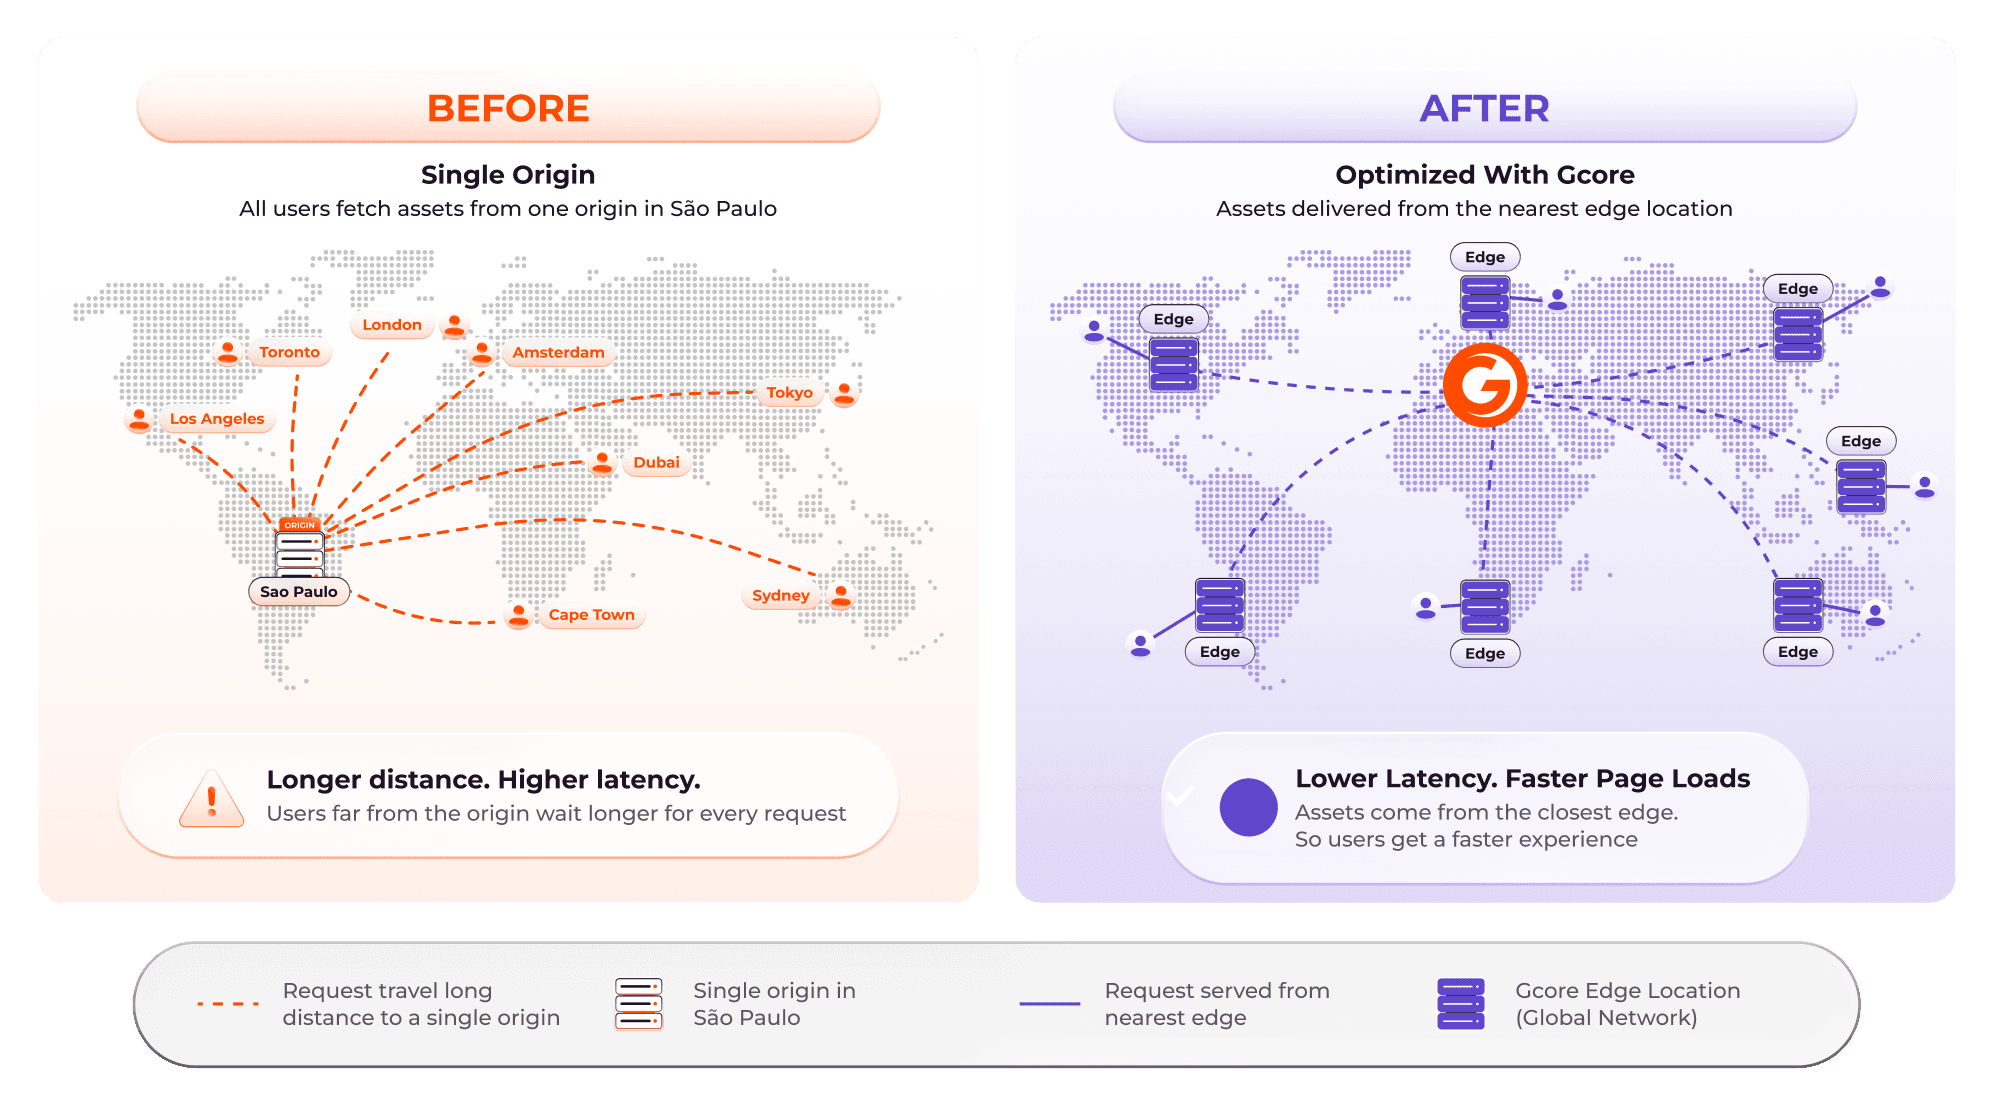
We used WebPageTest with Chrome v148 Desktop and a native connection with no traffic shaping. Each page was tested five times from São Paulo, Toronto, Los Angeles, London, Amsterdam, Tokyo, Dubai, Sydney, and Cape Town. Browser caches were cold for each run, while the optimized page used a warm CDN cache.
The published city figures are medians. “Finish time” in this article refers to WebPageTest's Document Complete metric. The 3,049 ms and 424 ms headline figures are averages of the nine respective city medians.
One Cape Town origin run recorded a Document Complete time of 13,472 ms, substantially longer than the other four. It was confirmed as a real result, so we retained it in the five-run sample. The published Cape Town median is 4,875 ms.
These are lab measurements rather than field data from real visitors. The experiment does not measure conversion rate, video startup time, or rebuffering.

Related articles

Most products do not launch with predictable traffic. They begin with an idea, a first release, and users who could be anywhere.Until now, starting small with Gcore meant starting with limited network coverage. Reaching 210+ PoPs meant choo




OpenClaw is an actively maintained open-source agent framework with an established community. Running an OpenClaw agent yourself, however, can mean configuring a server, connecting an inference provider, managing API keys, and maintaining t
Subscribe to our newsletter
Get the latest industry trends, exclusive insights, and Gcore updates delivered straight to your inbox.